Today I spent considerable time on a problem that confronts all software developers: how can you predict bugs?
I don't actually need to predict specific bugs, I need to predict how many bugs I'm going to find. This comes up when you're in the middle of testing something; you are some percentage of the way through testing, and you have found some percentage of the total number of bugs you're going to find. If you could predict how many more bugs you're going to find, and you know about how long each bug takes to fix, then you can predict when you'll be done. There is some of estimating involved, but it is better than holding your finger up in the air and taking a guess!
So what is the relationship between "% test coverage" and "% bugs left to find"? At first you might think this is linear, but it isn't; you find way more bugs in the beginning than you do at the end. This is mostly because many bugs are "global"; you will encounter them regardless of what part of the software you're testing. Installer bugs, for example, or bugs which keep you from accessing a database, or user signon bugs. As you get to the end of testing, you are finding bugs which only afflict a small number of things, or just one thing.
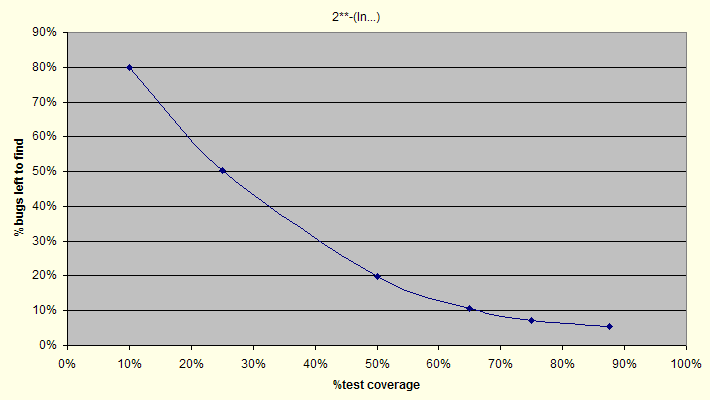
After playing with real data and bouncing "what if" scenarios off real developers and real QA engineers, here's what I came up with:

This is an inverse logarithmic relationship; as the test coverage increases, the percentage of bugs left to be found decreases, asymptotically approaching zero. After you've tested 10% of the software, 80% of the bugs remain, after test 25%, 50% remain, after testing 50%, 20% remain, and after testing 75%, 8% remain. This "feels" right, at least in my experience (and in comparing to actual data), but of course it could vary significantly for your team :)
Here's the actual equation:

Here t is the "test coverage", and f is the "resulting bugs left to find". The parameters a and b adjust the equation, for my purposes I determined a = 2.75 and b = 0.05, which yield the graph shown above. Here's what that looks like in Excel:
=POWER(2,-LOG(1/(1-(t/100)),2)*a)+b
To use this, you have to substitute the t, a, and b with the cell addresses which contain these values.
Having done all this, it turned out to be rather useful; I could apply this to each area of software in a release that we're in the middle of testing, and predict how many more bugs we're going to find, and hence, when we'll be done! It might not be right - that remains to be seen - but it feels better than just guessing :)
| 


